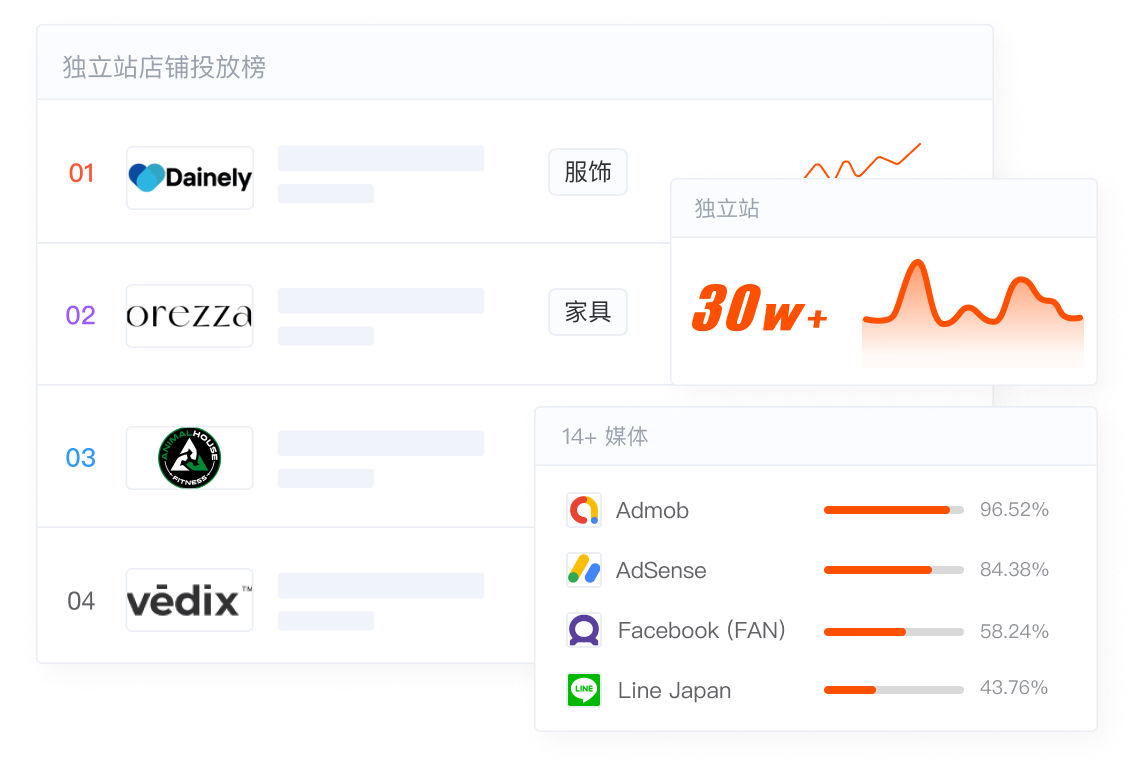

独立站店铺投放榜
独立站店铺投放排行,掌握一手大卖投放数据
| # | 店铺 | 品类 | 新投放广告数 | 新投放广告数环比变化率 | 在投放广告数 | 在投广告数环比变化率 | |
|---|---|---|---|---|---|---|---|
| 01 | - | 5,757 | 70.83% | 73,991 | 55.58% | ||
| 02 | 保健 | 909 | 83.18% | 59,419 | 35.17% | ||
| 03 | 母婴用品 | 796 | 90.81% | 48,708 | 14.91% | ||
| 04 | 手机与数码 | 33 | 92.60% | 47,180 | 41.80% | ||
| 05 | 箱包 | 638 | 83.11% | 26,596 | 7.24% | ||
| 06 | 服装 | 163 | 95.81% | 21,867 | 4.40% | ||
| 07 | 时尚配件 | 536 | 82.54% | 17,445 | 4.92% | ||
| 08 | 服装 | 316 | 87.75% | 16,279 | 13.01% | ||
| 09 | 服装 | 166 | 93.25% | 15,432 | 30.39% | ||
| 10 | 保健 | 261 | 77.44% | 10,899 | 5.85% | ||
| 11 | 美妆个护 | 97 | 86.58% | 10,697 | 28.78% | ||
| 12 | 家装建材 | 183 | 88.18% | 10,567 | 9.65% | ||
| 13 | 食品饮料 | 457 | 75.65% | 10,010 | 8.80% | ||
| 14 | - | 77 | 95.31% | 9,565 | 23.95% | ||
| 15 | - | 1 | 98.68% | 8,719 | 1.29% | ||
| 16 | - | 13 | 98.88% | 8,609 | 30.85% | ||
| 17 | - | 18 | 97.16% | 7,923 | 1.59% | ||
| 18 | - | 3,403 | 38.42% | 7,852 | 45.82% | ||
| 19 | 服装 | 72 | 93.02% | 7,285 | 19.56% | ||
| 20 | - | 3 | 96.00% | 6,983 | .06% |