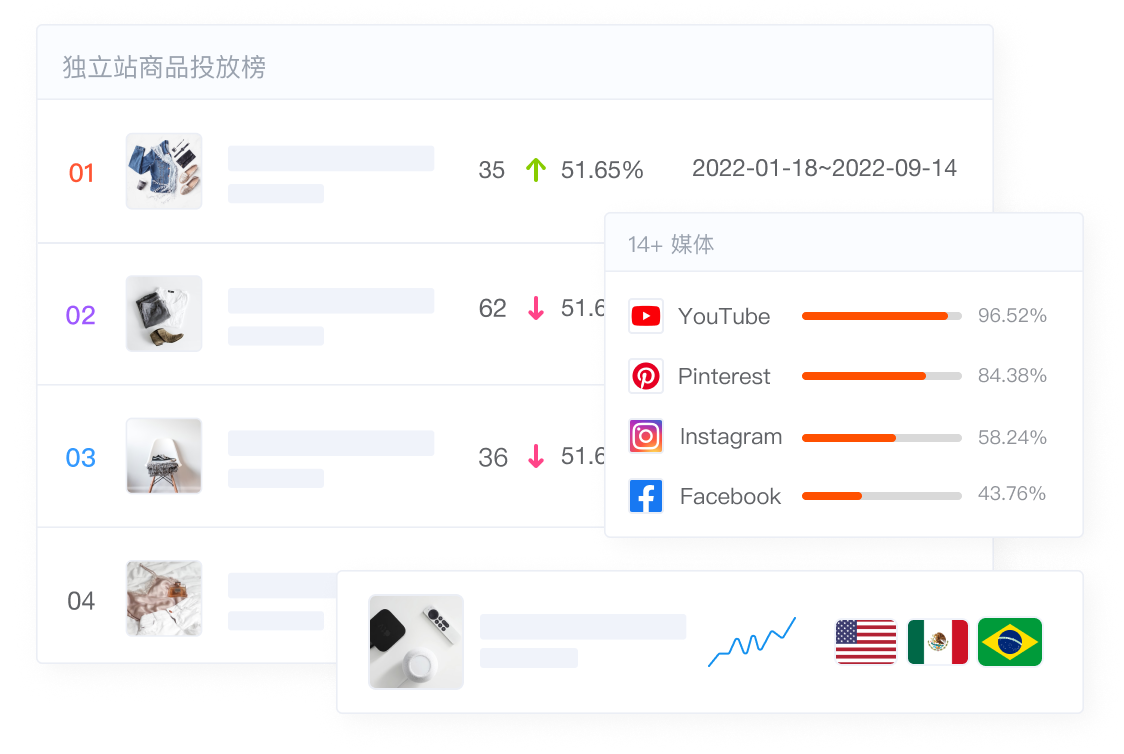

独立站商品投放榜
全球独立站商品榜单,实时追踪起量的新品及爆品
| # | 商品 | 价格 | 新投放广告数 | 新投放广告数环比变化 | 在投放广告数 | 在投广告数环比变化 | |
|---|---|---|---|---|---|---|---|
| 01 | 109.00 ~ 149.00 AUD 76.77 ~ 104.93 USD | 0 | - | 924 | - | ||
| 02 | 59.00 ~ 69.00 GBP 73.75 ~ 86.25 USD | 0 | - | 375 | 2.85% | ||
| 03 | 190.00 ~ 315.00 AUD 133.81 ~ 221.84 USD | 0 | - | 352 | - | ||
| 04 | 29.00 ~ 195.00 GBP 36.25 ~ 243.75 USD | 0 | - | 348 | - | ||
| 05 | 39.99 ~ 239.94 USD | 0 | - | 334 | 1.76% | ||
| 06 | 64.97 ~ 599.98 USD | 0 | - | 331 | 12.20% | ||
| 07 | 99.98 ~ 109.98 USD | 0 | - | 296 | 1.00% | ||
| 08 | 99.00 ~ 199.00 USD | 0 | - | 254 | 6.27% | ||
| 09 | 34.95 EUR 37.19 USD | 0 | - | 251 | 0.40% | ||
| 10 | 41.99 USD | 0 | 100.00% | 251 | 11.62% | ||
| 11 | 40.00 USD | 0 | - | 250 | 0.40% | ||
| 12 | 109.00 ~ 149.00 CAD 85.16 ~ 116.41 USD | 0 | - | 248 | 3.88% | ||
| 13 | 49.99 USD | 0 | - | 246 | - | ||
| 14 | 75.00 ~ 450.00 USD | 0 | - | 239 | 0.83% | ||
| 15 | 449.00 ~ 897.00 USD | 0 | - | 237 | 19.39% | ||
| 16 | 30.00 ~ 80.00 CAD 23.44 ~ 62.50 USD | 0 | - | 234 | 0.43% | ||
| 17 | 99.98 USD | 0 | - | 232 | 11.79% | ||
| 18 | 89.00 USD | 0 | - | 228 | 0.44% | ||
| 19 | 49.95 USD | 0 | - | 225 | 2.17% | ||
| 20 | 5.00 USD | 0 | - | 225 | 17.28% |
