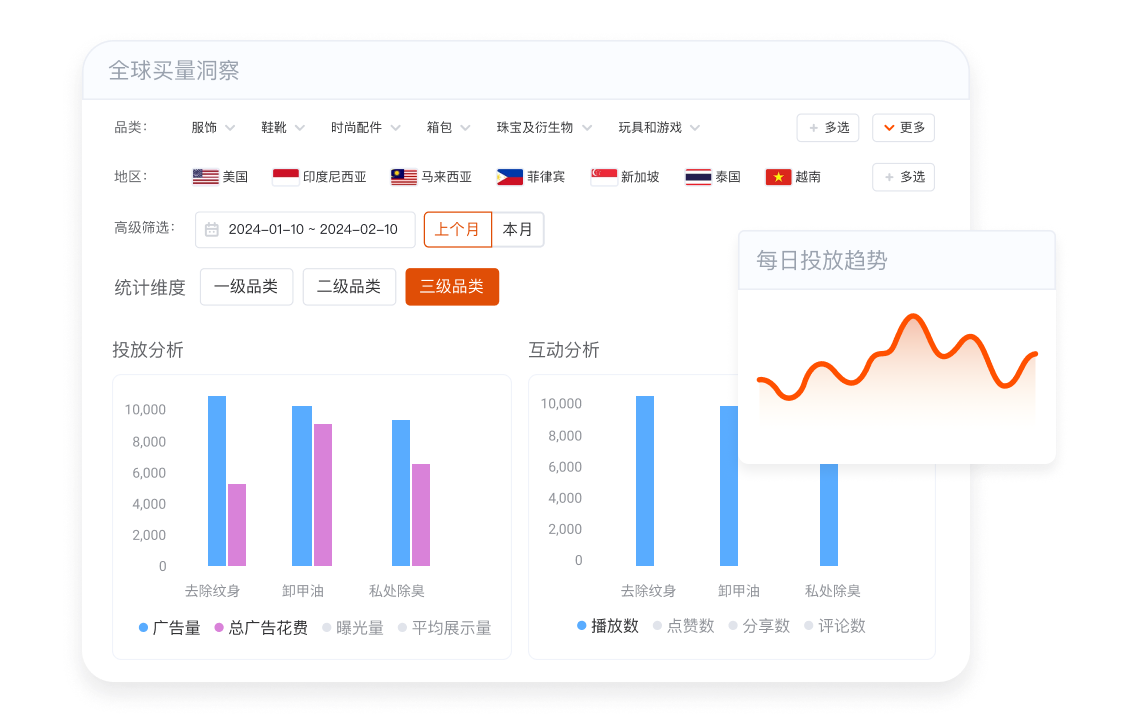

TikTok 全球买量大盘
卖家必读!帮你探索 TikTok 该做什么品类。
| 排名 | 一级品类 | 总广告花费 | 曝光量 | 日均广告量 | 点赞数 | 评论数 | 分享数 | |
|---|---|---|---|---|---|---|---|---|
| 01 | 美妆个护 | 17.0M | 6.2B | 168.1K | 18.9M | 284.3K | 291.6K | |
| 02 | 服装 | 5.8M | 2.6B | 167.9K | 9.1M | 165.6K | 180.8K | |
| 03 | 食品饮料 | 2.6M | 1.4B | 20.5K | 3.0M | 49.2K | 57.5K | |
| 04 | 时尚配件 | 1.9M | 758.3M | 37.4K | 2.5M | 38.5K | 50.8K | |
| 05 | 手机与数码 | 1.5M | 668.8M | 37.3K | 1.9M | 40.9K | 47.1K | |
| 06 | 居家日用 | 1.8M | 653.9M | 33.5K | 1.4M | 32.6K | 63.0K | |
| 07 | 鞋靴 | 847.1K | 507.8M | 29.5K | 1.3M | 25.4K | 30.7K | |
| 08 | 保健 | 1.7M | 434.5M | 10.9K | 1.2M | 21.6K | 33.7K | |
| 09 | 箱包 | 864.3K | 420.9M | 23.5K | 1.2M | 19.3K | 35.9K | |
| 10 | 家纺布艺 | 875.5K | 213.0M | 12.5K | 648.2K | 16.5K | 23.1K | |
| 11 | 母婴用品 | 366.2K | 204.9M | 8.2K | 407.1K | 8.3K | 12.7K | |
| 12 | 厨房用品 | 406.6K | 165.9M | 10.5K | 419.9K | 9.2K | 15.9K | |
| 13 | 家电 | 657.2K | 162.1M | 9.5K | 452.8K | 10.9K | 21.1K | |
| 14 | 运动与户外 | 496.6K | 156.0M | 10.7K | 547.6K | 12.5K | 14.3K | |
| 15 | 宠物用品 | 514.4K | 108.5M | 6.4K | 309.8K | 8.5K | 10.3K | |
| 16 | 五金工具 | 219.2K | 103.0M | 4.8K | 221.8K | 6.1K | 12.8K | |
| 17 | 家装建材 | 250.8K | 90.6M | 6.4K | 251.0K | 7.4K | 12.8K | |
| 18 | 电脑办公 | 276.0K | 88.5M | 3.8K | 196.1K | 4.9K | 5.0K | |
| 19 | 玩具和游戏 | 196.8K | 75.0M | 4.9K | 201.5K | 5.6K | 8.4K | |
| 20 | 家具 | 113.2K | 26.8M | 1.5K | 78.2K | 1.2K | 2.5K |
